
Crude Oil Report
Long seasonality from December
REPORT
By Edoardo Pirola and Mario Coronado
11/17/20232 min read

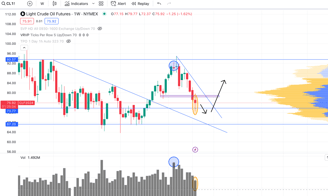
The blue circle on the chart highlights a significant high point that faced strong rejection, accompanied by substantial volume—a clear indicator of active selling pressure at that juncture. The subsequent week witnessed the liquidation of previous highs, swiftly followed by a re-entry into the $93 range.
Weekly Chart
Daily Chart
For an extended period, "Black Gold" prices hovered between $64 and $84 per barrel, until recently when they surged to $94. There was a flurry of anticipation, with many predicting a climb to three-digit figures, only for oil to subsequently decline. This can be a consequence of a significant manipulation effort within the media, capitalizing on the Middle East's challenges to instill unwarranted fears among investors.
Hourly Chart
This week saw significant declines, but remarkably, they were nearly entirely recuperated during the last session. Observing the return to a zone previously marked by robust bullish movement and considering this week's rejection, identified by a volume indicating a lack of interest in lower prices (NS or no supply), coupled with historically bullish trends in December, we anticipate an imminent upward trajectory in prices. Nonetheless, our analysis suggests that in the upcoming months, it's highly improbable for prices to breach the lateral range set between $64 and $93-$94.

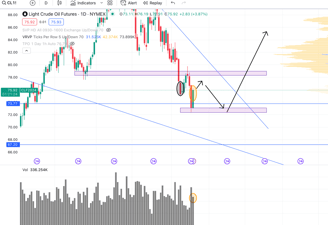
A detailed review of the daily chart offers insight into recent events .After the break of a very important low, first purple rectangle, the price created a very powerful demand candle, a not very big body but with a very strong volume. This is a clear indication of the presence of a lot of demand inside that candle.
In fact, from there, the prices went back up to the relevant area broken earlier without the support of volume (the low volume was also given by a nearby expiration of contracts, futures). After that, during this week, the prices went further down, finding, however, in Friday's session a very positive rebound using little volume, especially right after having cleared a prior low that was quickly recovered (horizontal line = support).
So we expect that oil may still not move much yet, but mostly within this range it created this week. After that, we expect prices to go back up, probably in conjunction with the return of positive seasonality around late November or early December. This would then remain positive until early March.
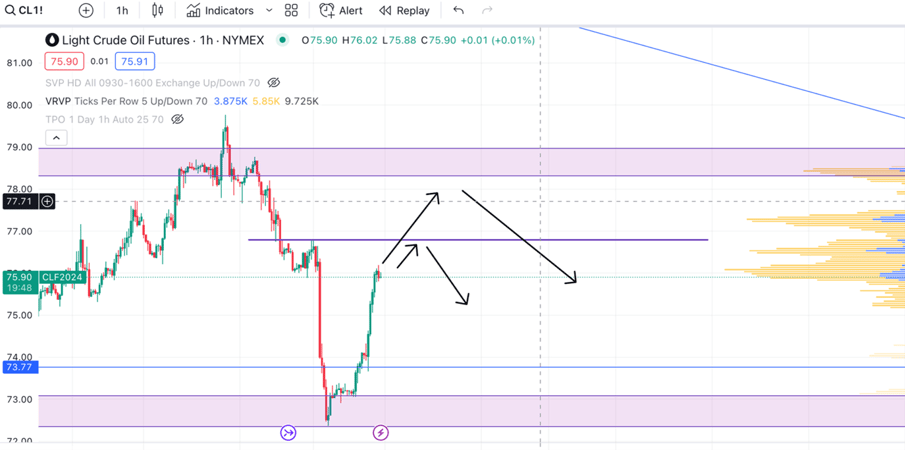
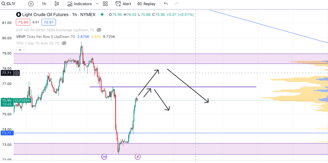
In the short run, we see as a clear target the resistance drawn on the chart that will delineate the direction of the next short-term impulse in oil.
Join Our Discord to Keep up to Date!!