
Nasdaq Report
The underlying trend remains bullish and it is very likely that we will reach all-time highs at the end of the year.
REPORT
By Edoardo Pirola and Mario Coronado
8/28/20233 min leer
In recent weeks we see how a "block" of volumes has formed (highlighted in Yellow). In this case we do not find any volume peak that stands out but the set of bars result in an attempt to momentarily stop or reverse the price. In all likelihood we are in a corrective process after the strong rise that we have seen since the beginning of the year. Our opinion is that the correction we have seen so far is not enough and there is still room to go down. Let's see everything in more detail.
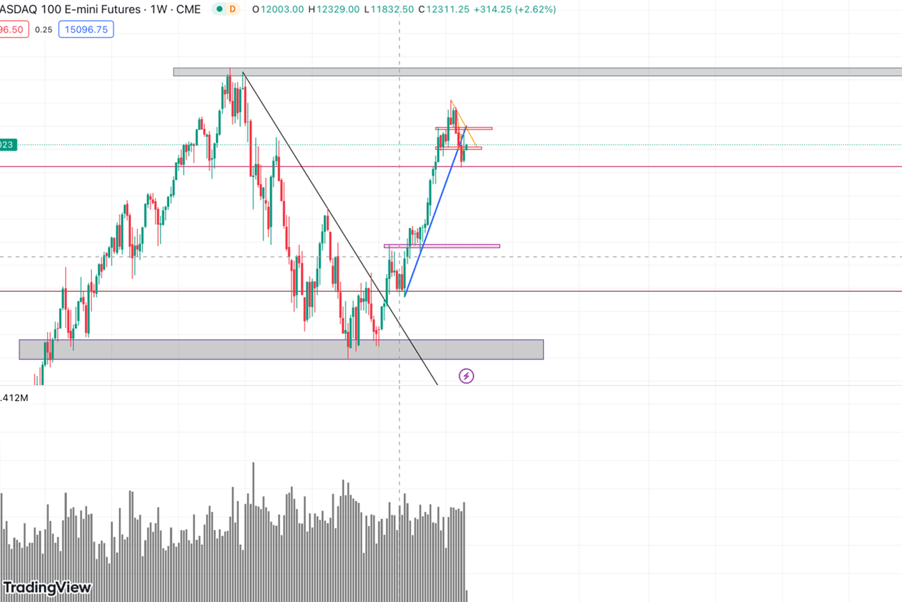
Weekly Graph:
Daily Graph:
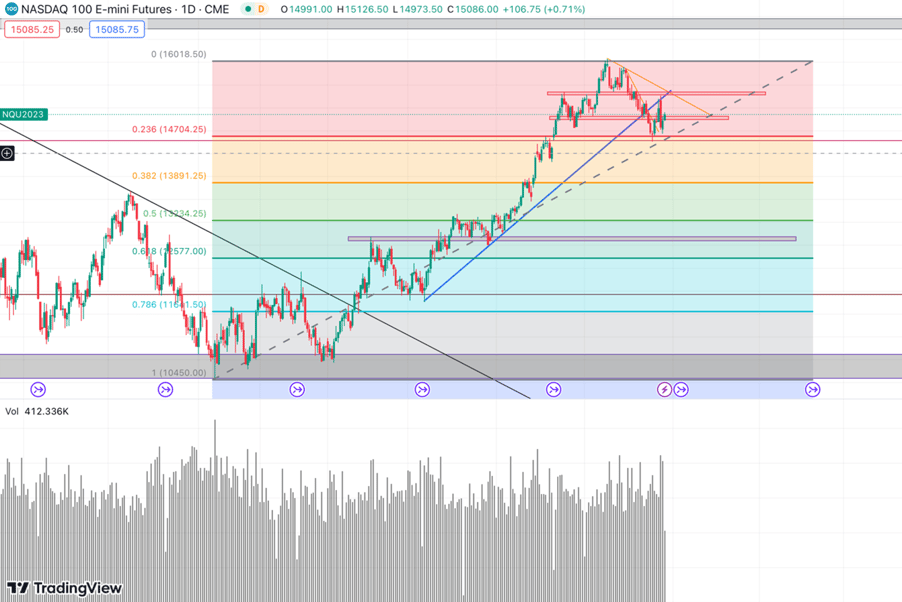
In this graph we can appreciate several technicalities more clearly:
As we trace a Fibonacci structure, we see that the correction is still short considering the bullish stretch that we have experienced (This is assuming that we are in a correction of a greater degree - We interpret this thanks to the volumes as we have said before)
The bullish trend has been momentarily broken and tested with a strong rejection volume that has caused a reversal with a very bearish connotation. Yellow
Until the trendline of the corrective process is broken, we do not think about long term positions.
The cyclicality (we will analyze later).
We expect the correction to extend to levels between 38 and 50% of Fibonacci at confluences with this important area. Pink
Let's now look in a little more detail to get an idea of what has to happen for the approach I have proposed to be activated or cancelled.
Hourly Graph:
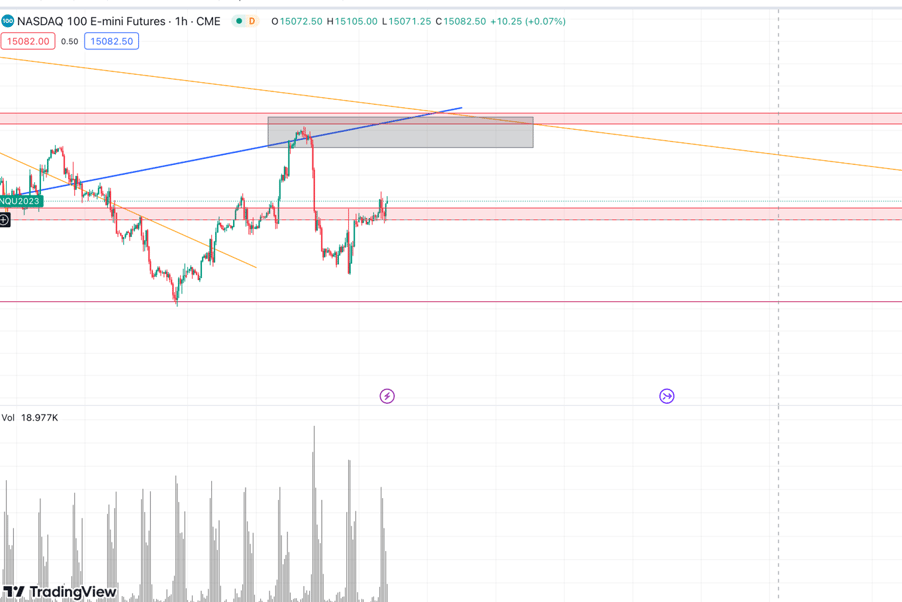
Here we see better how the 15,400 level has been quickly rejected by the market. Yellow
Until that area is broken, we continue with expectations of shorts when the ideal scenario for the turning point occurs.
This could occur when you retest that area, possibly in confluence with the corrective trendline.
It is possible that this does not happen and the price turns around sooner, for this you have to look for opportunities in the intraday to be able to enter optimal levels.
A break below the level of 14600 (which is what we are looking for) would lead us to an acceleration of the bearish corrective process, it is an important area. Pink.
An entry into the testing of that area after a possible breakage would be perfect for a more conservative profile.
In addition, we also have statistics in our favor:
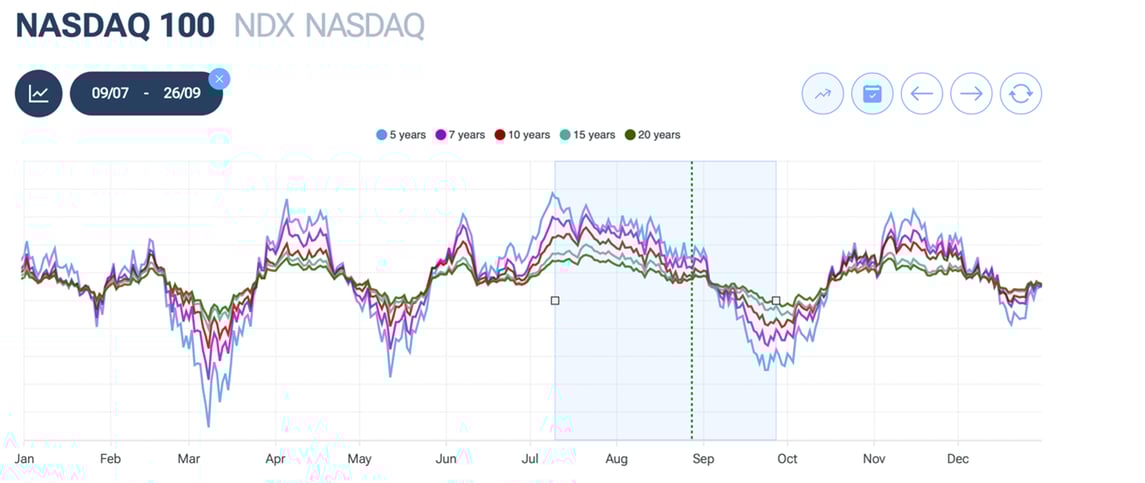
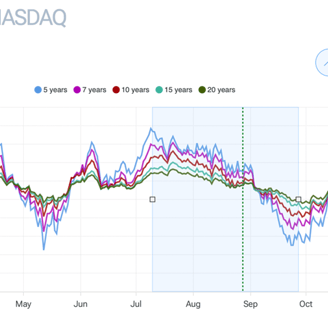
Trend cyclical chart (eliminates the influence of previous trends)
Here we can see how the months of August and September are historically not good for the index, also right in the first days of September we see how historically there has been an acceleration in the decline in prices. This could also happen this year. In October it is finally very likely that prices will look upward again.
Final comment:
The general scenario is bearish until that level of 15,400 is broken, which is very difficult to break (The underlying trend remains bullish and it is very likely that we will reach all-time highs at the end of the year)