
Weekly Analysis: Copper
REPORT
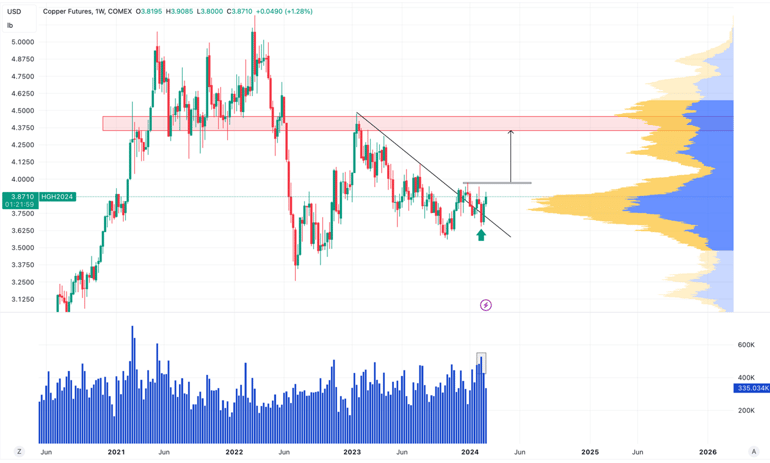
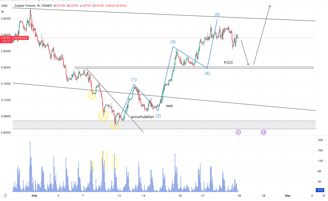
In this broad dive chart we can see in the upper zone an important resistance that was created after the break of the 2021 distribution that serves as a long term control point.
Right now we have broken the bearish trendline, and we should find a bullish period for the copper, after the break of a few more levels that we will analyze in smaller time frames.
This is also confirmed by the candle shown on the chart, which at first glance would appear to be full of supply, but from its ample volume and the fact that it was immediately absorbed, in retrospect we know that it was demand. The drop below that level would support a change of scenario
We can see from the volume profile that we are in a zone where there has been a huge dispute between buyers and sellers, so we expect that when the price starts it will do so with strength.
Weekly Chart
Daily Chart
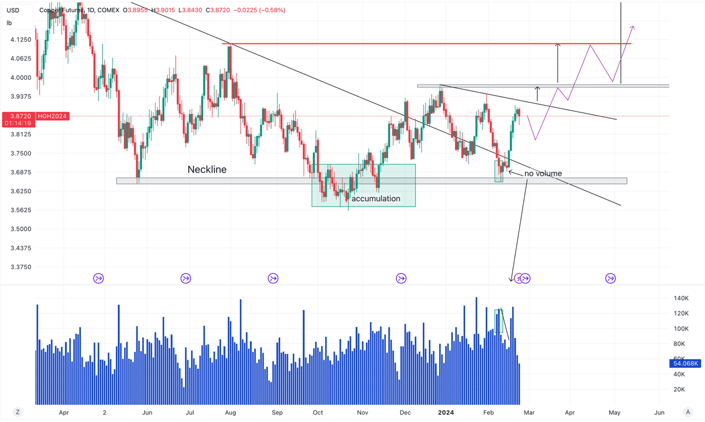

In the daily chart we take a closer look at what we think will be the last price structure before its uptrend. We see how a clear neckline has formed at the bottom which corresponds with the no-lose point identified above. There has also been a mini-accumulation at the bottom also acting as a dilation/false breakout.
In this last approach to the neckline we saw candles with a lot of volume that stopped the decline and after the rebound a volume completely disappeared, a symptom, in this situation, of a lack of supply, so that prices rebounded strongly. We see above drawn the levels to break through and a hypothetical price movement.
Hourly Chart
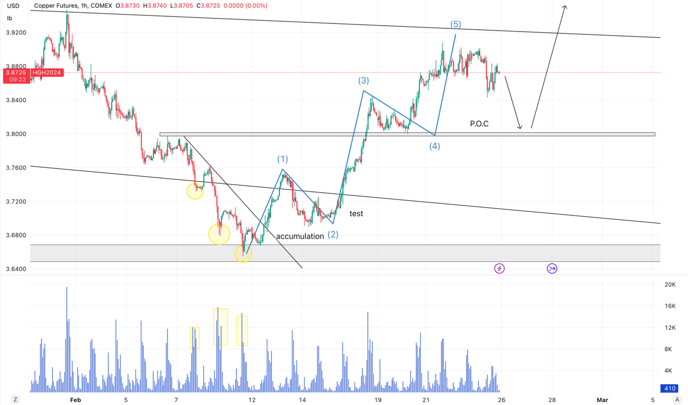
Here we see how the rebound from the neckline just mentioned really unfolded. In fact, we see a descending accumulation, less typical than normal laterals. After the trendline break there was a test and from there the price started strongly.
Normally we do not use "Elliot waves" to analyze the charts, but in this case the structure is flawless, so we see how the 5 waves have developed perfectly, which reinforces our strong bullish theory as these 5 waves should form 1 big long term wave.
COT Report
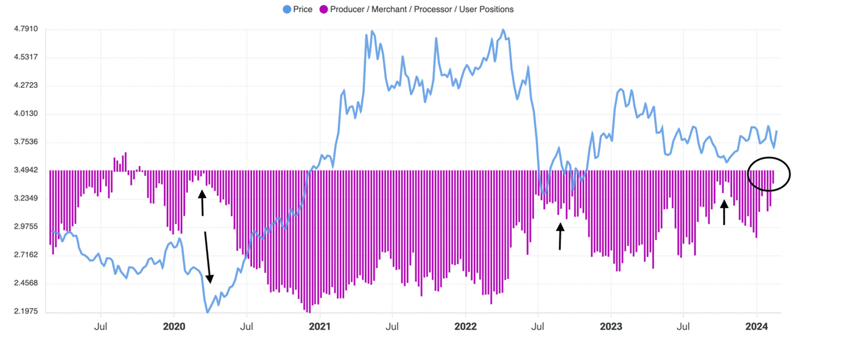
To finish the analysis, let us consider the Cot report. “The Commitment of Traders (COT) report is a weekly publication that shows the aggregate holdings of different participants in the U.S. futures market.” In particular, we will look at the producer section. Those in the section produce Copper and they are the ones who initially sell it. Their profit lies in the price of copper, so to protect themselves from the volatility of its price and hedge themselves they buy futures against the price of copper itself, hence they go short on copper.
When they think the price is too low they no longer go short because they think their product is undervalued and will therefore go up.
We can appreciate from the chart that in the past, this has been the case: When they were less exposed on the short the price went right back up and right now a situation like this is reoccurring. Those who are more in contract with the product than anyone else think the price is at a low.
CONCLUSION:
In conclusion, we reaffirm that our view for copper is long, and we ourselves will look for upside opportunities on this commodity.
The confluence of the chart analysis and the cot report brings the statistics in our favor: the probability that what we expect will actually happen is higher than if we only considered one of the two.