
Nasdaq Session Report
A step by step analysis...
REPORT
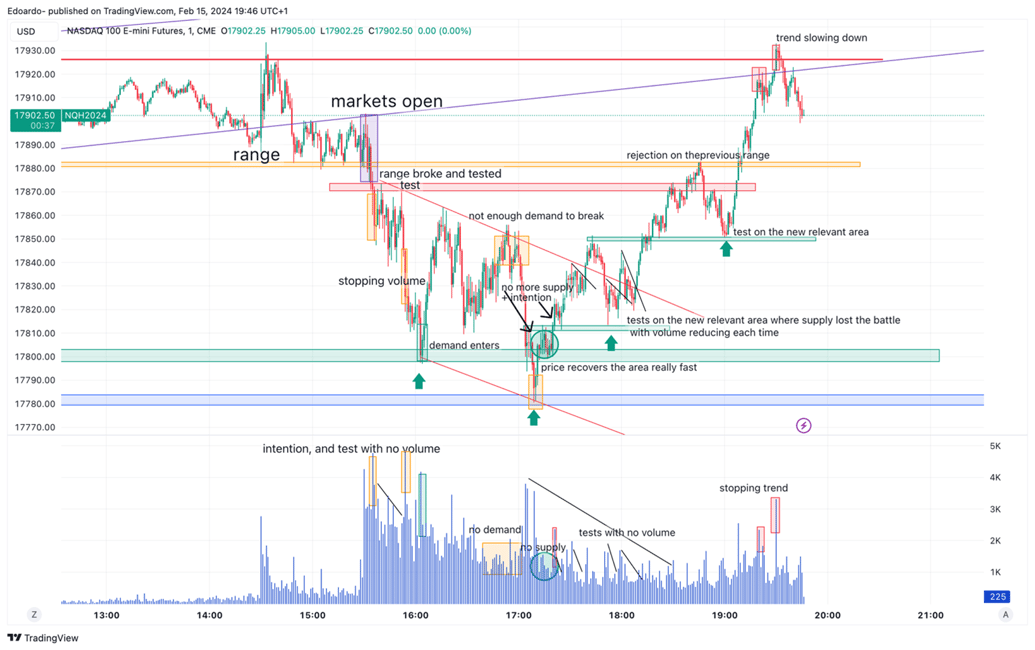
The market opens, breaking the range it was in with candlesticks of intention.
The price recovers the zone and rejects it; in the process, the volume decreases; this means that it was a test for the breakout.
Just after that, more intention bars appear and push the price down again.
Afterwards, demand starts to enter a relevant zone in wider time frames—very high volume for the candle it is. The price keeps going down, but soon demand enters, and the price rises almost to the area of the breakout test mentioned above.
The price is rejected, but it does not lose the area where the breakout was created and tries to go up again.
In this second attempt, we see how the volume is very low and the price is rejected: there is not enough demand or lack of supply to continue rising and break the range that is forming.
The price breaks all the lows, and more volume appears again.
In this case, the lows recovered very quickly, making us understand that it was a bearish fakeout( or spring) or price dilation.
The price holds the clavicular, and the volume is lost. There has been a drying up of the supply; from now on, there is only strength to go up. Demand has won the battle.
From here, a candle of intention comes out, and the price rises, fails to break the trendline, and retests the new relevant area (the one of the break after the drying up).
All the tests are accompanied by volume drops, which means that the supply continues to fail to appear.
The range is finally broken and reaches its target, the previous range.
Here, the price is rejected and tests a previous high, which is now the P.O.C. (Point of Control).
From here, the price shoots back up to the top of that previous range, where the trend starts to slow down with the appearance of supply.
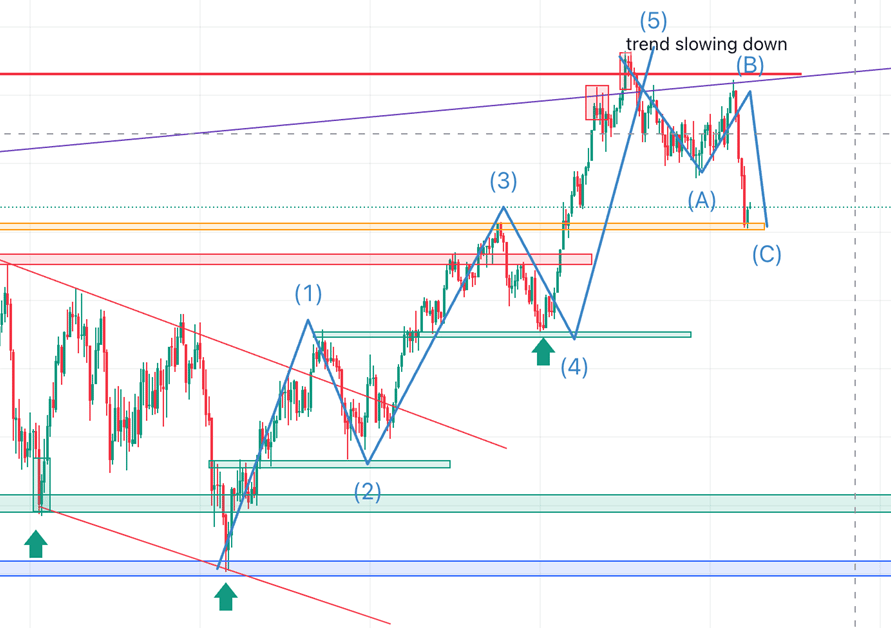
Another perspective
The upward momentum from the lows can be described in Elliot waves as well.
From the last low to the descending trendline, wave 1 is created, the correction is wave 2, the new impulse that reaches the range of the beginning of the session is wave 3, the correction is wave 4, which just stops at the high of wave 1, and wave 5 reaches the high of the previously mentioned range.
Also, the "A,B,C" correction is present.