
Nasdaq Weekly Report
We are approaching a key area which if broken will give rise to a new uptrend, otherwise we may have to wait a little longer for this or even see new dips.
REPORT
By Edoardo Pirola and Mario Coronado
11/4/20232 min read

We can see how in the past weeks our vision has been confirmed. The price has reached our target and rebounded strongly.
We can appreciate that the volume that left this weekly candle is a "no demand" candle, which can mean two things: the supply is extremely weak that the price could rise without strength, or this rise is not as true as it seems, and we still have some lows to look for.
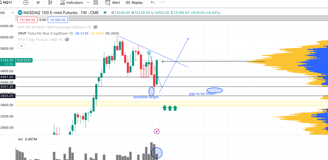
We are in a key area
Weekly chart
Potentially, there are lower targets to be reached, but it is not the most likely scenario that new lows will be made.
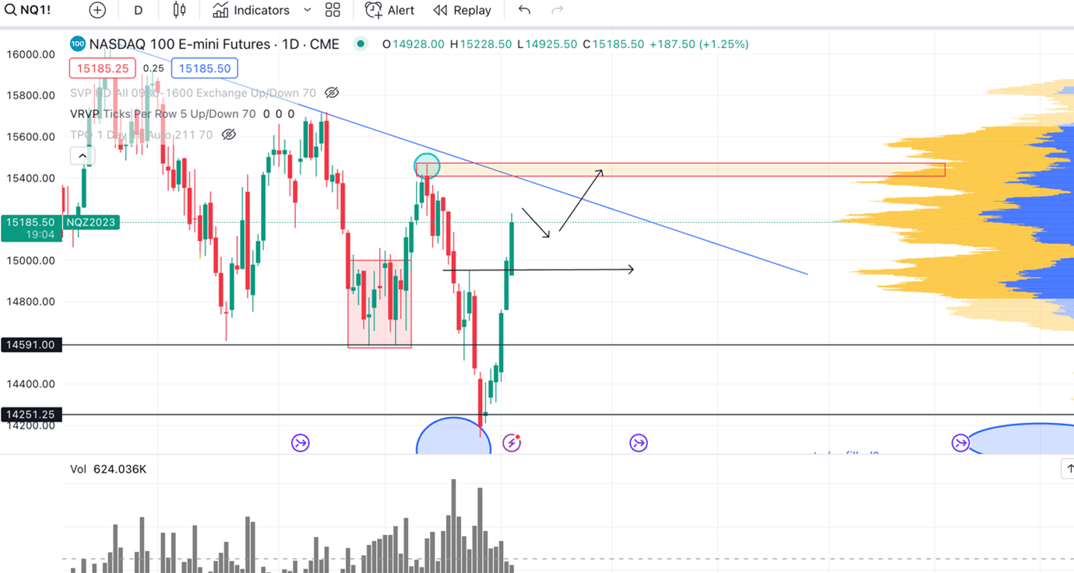
Daily chart
In this chart we can zoom in the next price target, which is the previous high marked by the orange rectangle, apart from the confluence that this price zone forms with the bearish trendline. Due to this trends, it is very likely that the price still has some way to go (we will see in the hourly chart how it might get there,).
The break of this level would be the one that would indicate that the bearish period is over, and we could see further rises.

Hourly chart
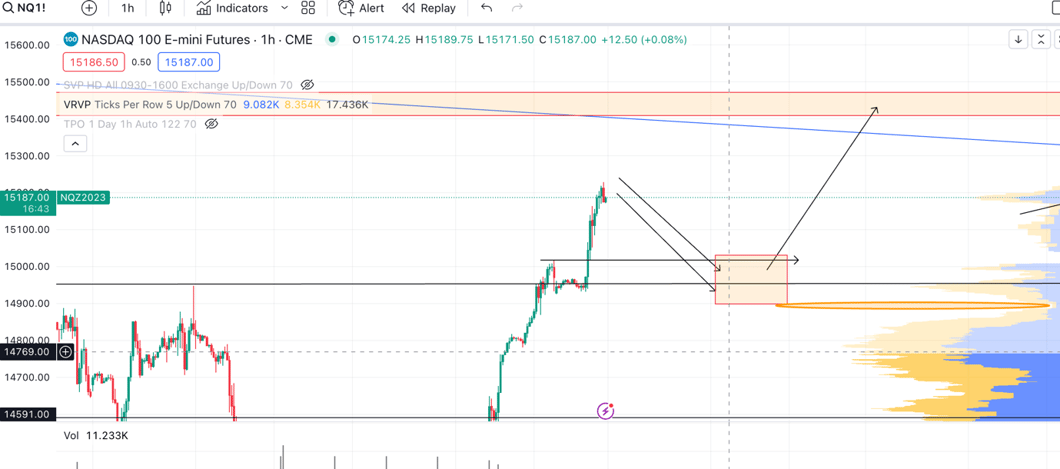
Let us now try to analyze the possible path of the price towards our target.
We are coming from a rallying week with practically no hold back. Obviously this could continue like shown and leave practically no clear entry opportunities up to our target, but the entry scenario we consider involves a correction up to the levels of around 15,000. If the price arrives there we will look for all possible entry opportunities with a final target of 15,400/15,500.
For long-term indications of operational days follow us on Discord
In conclusion, we are approaching a key area which if broken will give rise to a new uptrend, otherwise we may have to wait a little longer for this or even see new dips. In the meantime, we can take advantage and make some trades towards the target.